Using the Dashboard
Summary
Stores
Stores Tab Overview
Stores > Status
Stores > Technical
Stores > General
Web Based Store Inventory / Online Menu
Download a Pick List for easy restocking
Stores > Restock
How To Set Pars
Sales Tax
What is a KID?
Stores > Discounts
Stores > Financial
Products
Export Lots as CSV
Products > Transactions
Delete/Undelete (or Archiving) a Product
How to repurpose tags
How to Bulk Import Products
Products Overview
Products > Tag Orders
Export EPC Inventory
Products > Inventory
Add a Product
Products > Details
Tags
Transactions
Understanding Transaction Preauthorization and Processing Times
Transaction status definitions
Transactions > Logs
Coupon Reporting
Transactions > Customer Emails
Edit the default preauthorization amount
How to adjust a transaction or process a refund
How to View Transactions & Transactions Overview
How to Export Transactions for Enhanced Sales Analysis
How to prevent mischarges
Feedback
Discounts
Discounts > Add a Happy Hour Discount
Discounts > Add a Standard Discount
Discounts Overview
Discounts > Creating Coupons
Discounts > Add a Shelf Life Discount
How to redeem a coupon
How to end a Discount
Financials
Settings
Getting Started
Remittances
Transactions included in a remittance
Remittance Processing Schedule
How do I provide my banking information?
Ordering Tags
Restocking Product
Setting Up Your New Store
How to restock a Byte store
Setting up your store to be NAMA-certified
Custom graphics install instructions
Branding your store
Setting up your Byte Technology store
How soon will I receive my store?
Standard Byte Store Specs
Tagging Best Practices
Tagging Frozen Food
Tagging drinks
Tagging Non-Perishable Products
Product tagging best practices
Tagging sandwiches, wraps, and burritos
Tagging snacks or soft packaging
Tagging soups or yogurts
Tagging salads & hard packaging
Are RFID tags microwave safe?
Merchandising best practices
Test and verify inventory
Tagging heatable entrees
Tagging aluminum cans and foil-lined products
Dashboard Onboarding | A self-guided training
1. Introduction to Byte Technology Dashboard
2. Overview of Summary Page + Navigation Bar
3. Stores Section Overview
4. Products Section Overview
5. Transactions Section Overview
6. Feedback
7. Discounts Section Overview
8. Financials Section
9. Settings
10. Congratulations
Campus Card Stores
Byte Store Dimensions/Store Types
Troubleshooting & FAQs
Connectivity
How to Install an OptConnect Cellular Device on a Byte Store
Ethernet setup and networking requirements
Transactions made while store is offline
How do I get a store back online?
Code 400C
Code 600
Code C
Code E
No IP / Red or Yellow Border
Code 200
Sending Remote Commands
Screen Issues
Store Temperature
Inventory
Antennas in the Byte Store - Where to Place Your Products
Customer Inquiry: Need Help With Your Transaction?
Code 400
Door Lock Issues
Open a CSV file in Excel or Google Sheets
How to Reach Support
Combatting Theft With Your Byte Store
Error Codes: Out of Service Troubleshooting Guide
- All Categories
- Using the Dashboard
- Summary
- Summary Page Overview
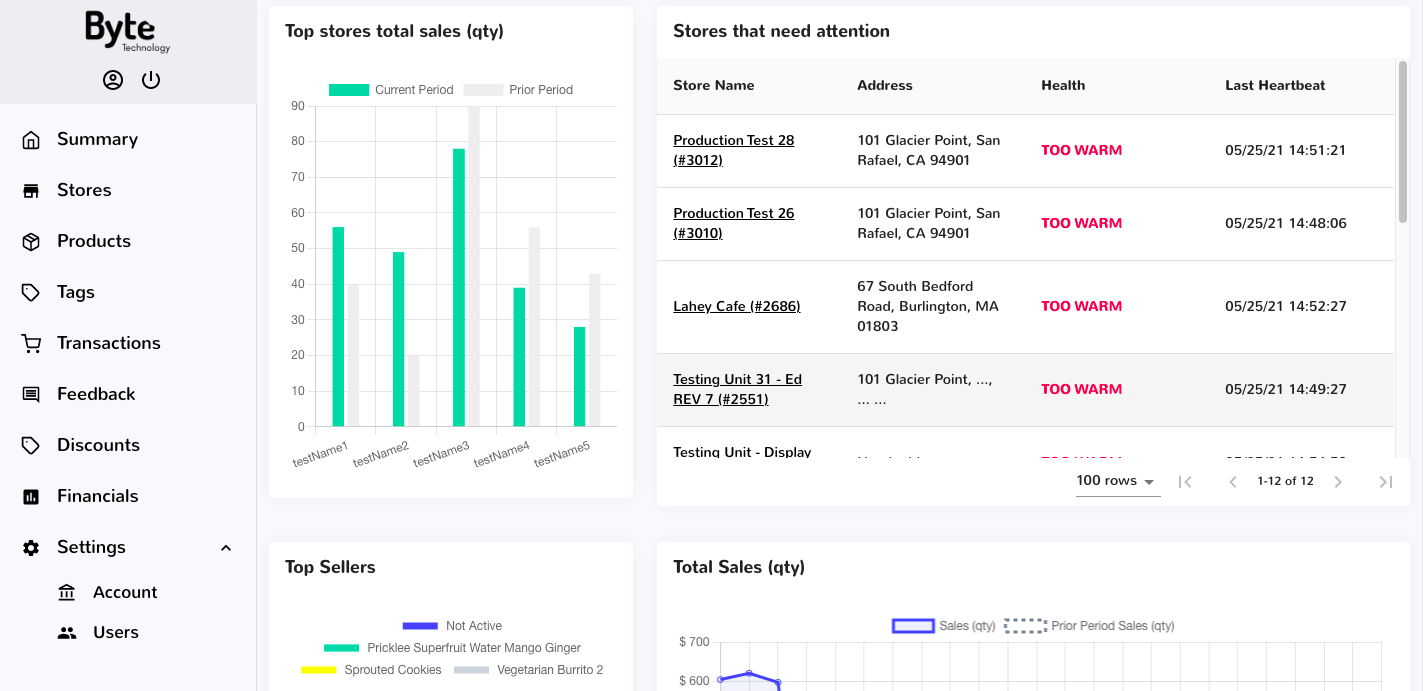
Summary Page Overview
The Summary tab gives you a high-level overview of how your fleet of Byte stores is performing in real-time by displaying sales, spoilage, Byte stores that need attention, Byte Stores with out-of-stock pars, Product Performance, and Store Performance.
Sales Data Overview
Gain a quick snapshot of how your Byte store sales are doing on a daily, weekly, or monthly basis by selecting the green tile in the upper right corner and picking a time frame. Once a value is selected, the data on the summary page will update to the corresponding values and all charts/tables will update accordingly to reflect the data you wish to see.
The following sales data types displayed on the summary page are as follows:
Sales by $ amount, Sales by (qty), Sales by Category, Credit Card Sales ($), top Byte stores total sales (qty), Total Sales (qty)
Sales ($): dollar amount in sales since the prior period
Sales (qty): number of items sold since the prior period
Sales by Category: shows you the number of food items sold by menu category (this is a great way to help determine your most popular food items and supply the demand!)
Credit Card Sales ($): a detailed overview of credit card sales that displays hour by hour (last 12 hours) and dollar amount
Top Stores Total Sales (qty): this will display the top 5 stores with the highest number in sales by quantity
NOTE: if you have under 5 stores, all of your stores will still appear here and display accordingly in the chart.
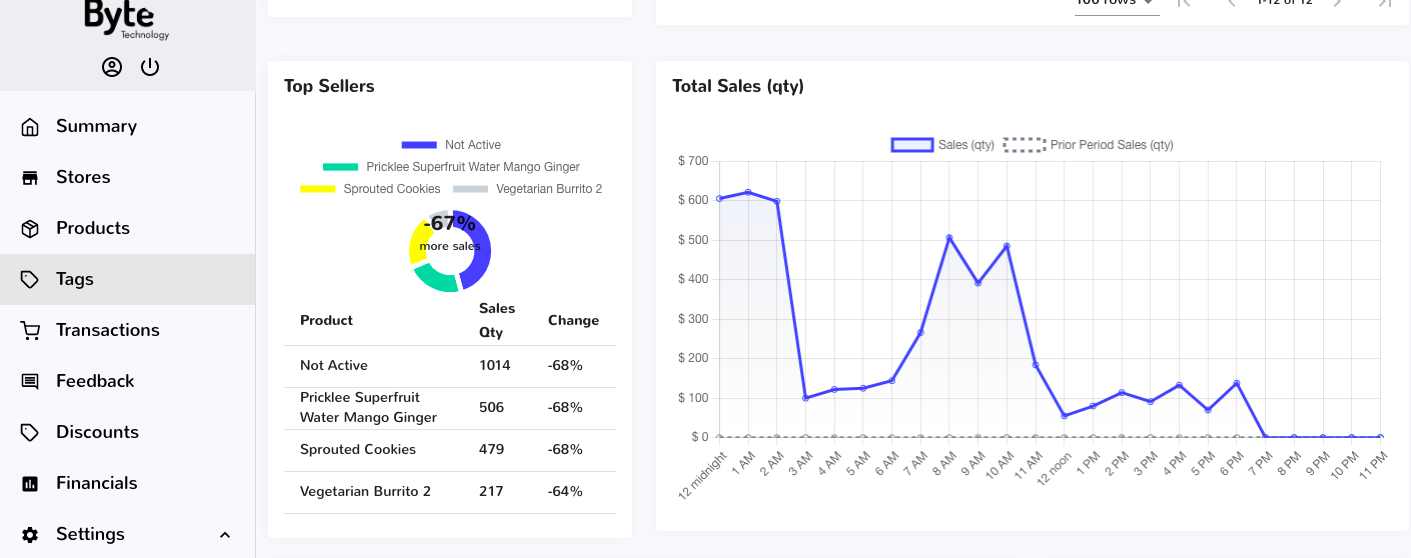
Total Sales (qty): a line graph that shows total sales in dollar amount from the last 12 hours
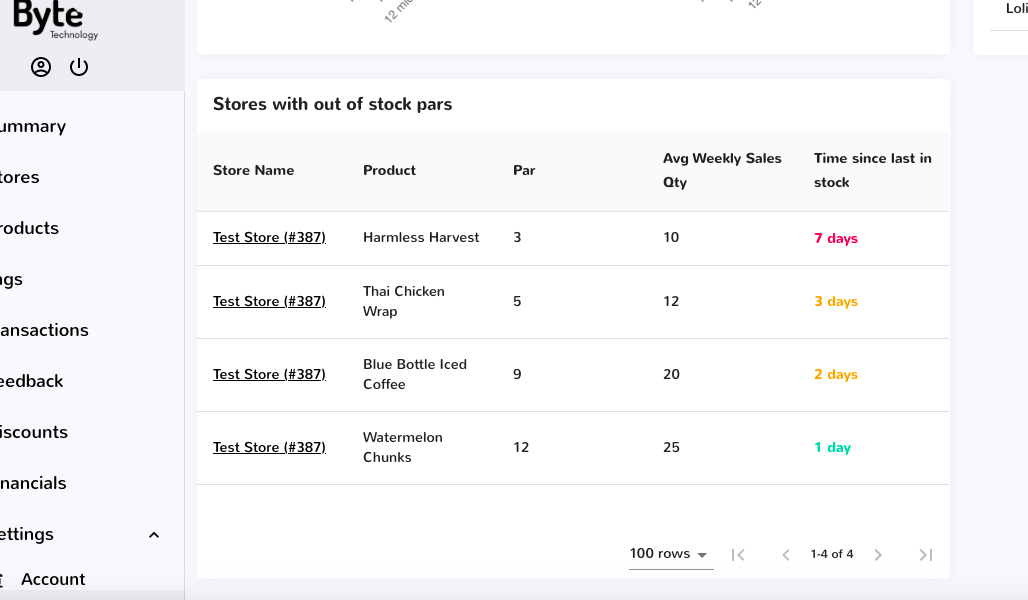
Byte Stores with Out of Stock PARS
This section displays Byte stores and time since last restock line by line, as well as the product and average weekly sales for that product. See the example in the screenshot below.
Top Sellers and Product Performance
View how well a product is doing by scrolling down to Top Sellers on the Summary Page. Top Sellers will display the top 3 most bought items and display sales in Quantity as well as change in percentage.
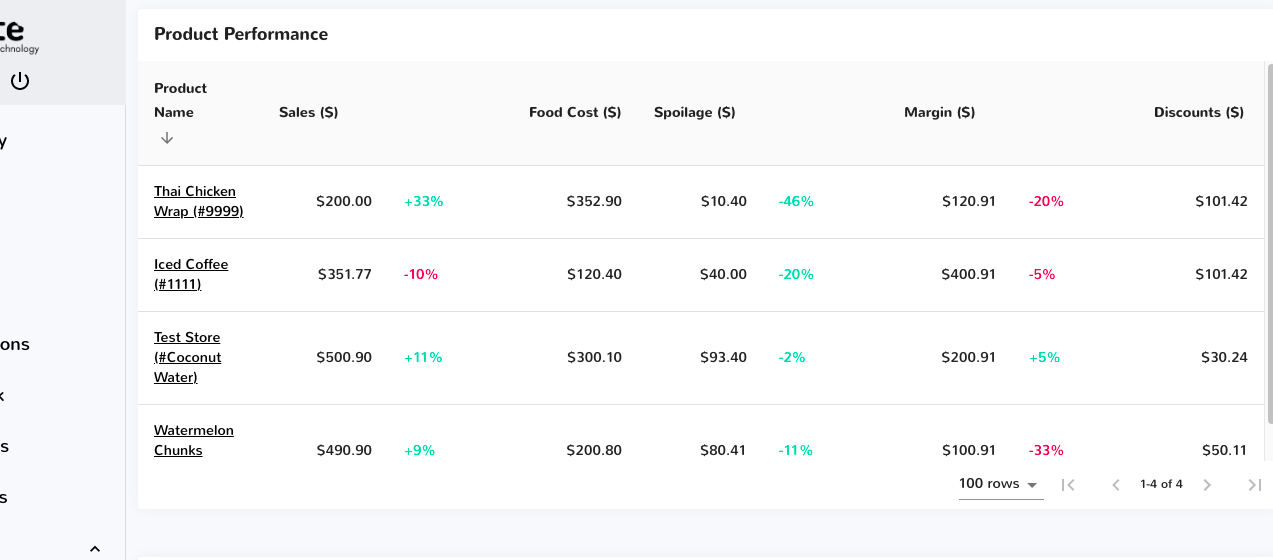
Product Performance
Product Performance: in this section, find a brief overview of each of your products, sales generated for each, food cost (supply), spoilage ($), margin ($), and any discounts ($) associated with the product.
Spoilage Data
Keeping track of spoilage is just as important as keeping track of sales. At the top of the summary page, you can view Spoilage ($) in dollar amount for all stores since prior period. You can also view this data at the store or product level by scrolling down to Store Performance or Product Performance.
Select the green tile in the upper right corner to filter out spoilage by the options below. All categories in this section will update to the selected filter.
NOTE: To REFRESH the Summary Page, select the arrows appearing in a circular motion in the top right corner as shown in the picture above.
Byte Stores That Need Attention
This displays all of your Byte stores, corresponding addresses, health, and the date and time of the stores; last heartbeat. This overview provides a quick and efficient way to view all of your Byte stores' health in one snapshot.